Dashboard
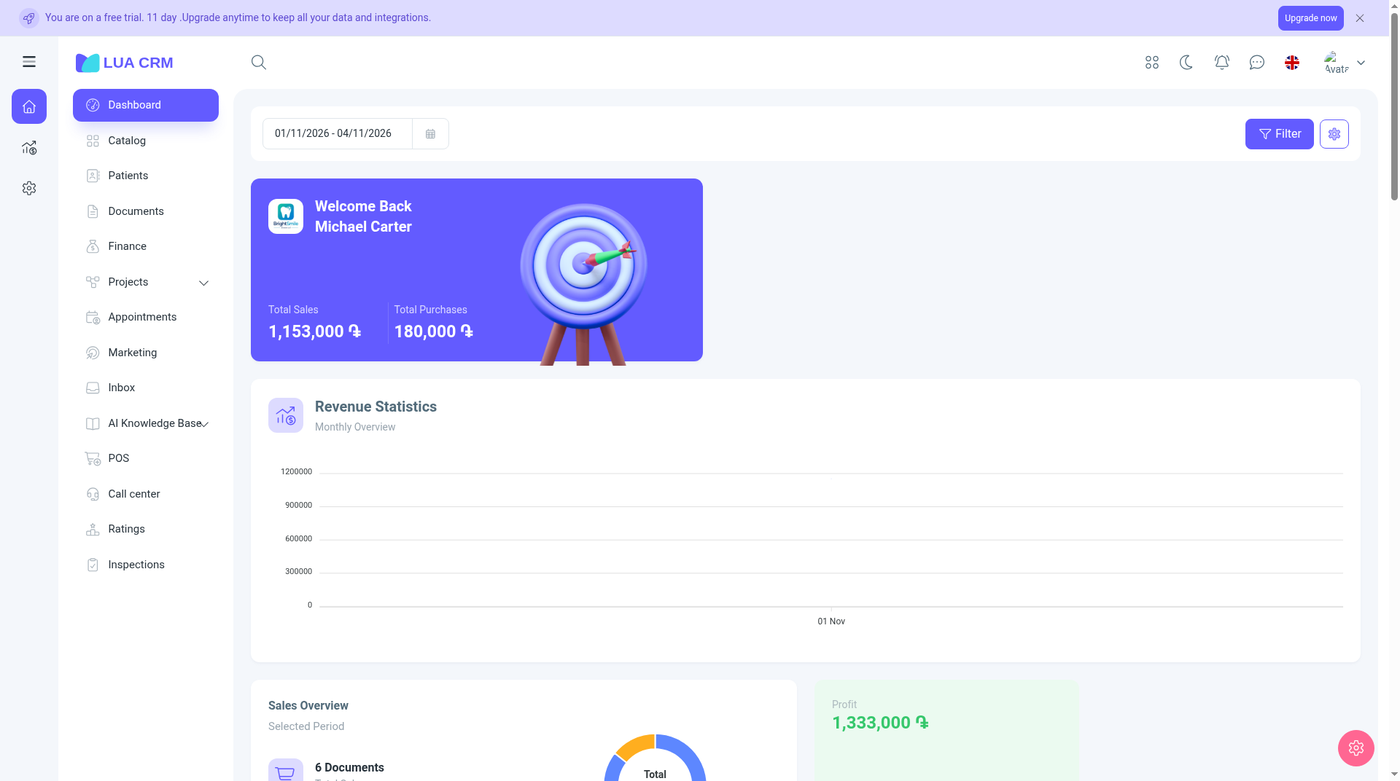
The dashboard is the first page after sign-in (/). It summarizes the period you pick: sales, purchases, profit, and cash, plus any other widgets an editor has placed on the board. If your role cannot open the dashboard, Lua CRM sends you to the first module you can use instead.
When to use it
Open it at the start of the day to see whether sales and purchases moved, which currency balances changed, and whether a widget you rely on (for example an RFM customer list) needs attention. It does not replace Documents or Finance. Those are where you create and correct records.
Filter the numbers
The date range defaults to the first day of the current month through today.
- Set the date range. The format is
DD/MM/YYYY – DD/MM/YYYY. - If you can work in more than one branch, choose a branch. With a single branch the branch list stays hidden.
- Choose Filter.
Amounts use the company’s main currency symbol.
What the standard board shows
The BrightSmile board includes:
- A welcome line with Total sales and Total purchases for the signed-in user
- An income chart. If there are no sales in the period, the chart shows an empty state
- A sales summary comparing sales documents with purchase documents
- A profit card
- Cash balances split by currency
Widget catalog
Manage widgets lists every widget your role’s modules allow. A widget tied to a module you cannot open is hidden. Top items and low stock are hidden until the catalog has at least one item. Widgets that still contain sample numbers are hidden until they read real data. You can rename a widget on the board. That title is only for this dashboard.
These widgets use the date range and branch filter on the page.
| Widget | What it shows |
|---|---|
| Welcome | Company logo, your name, total sales, and total purchases for the period |
| Sales overview | Count of sales documents and purchase documents, plus a donut of the split |
| Sales and purchases | A chart of the last 12 months |
| Revenue | A monthly revenue chart |
| Income and expenses | Income, cash collected, expenses, and profit, then the income categories and the expense categories |
| Profit | One figure. Opens Documents |
| Documents by type | A chart of how many documents of each type |
| Receivables | What customers owe. Opens Obligations |
| Payables | What you owe. Opens Obligations |
| Cash by currency | One total per currency |
| Wallets | Each wallet, its currency, and its balance |
| Recent transactions | Date, type, and amount. Show more opens Finance |
| Low stock | Products at or under their minimum. Name, current quantity, minimum, and a count |
| Top selling items | Products, services, and memberships by quantity and revenue |
| Top customers | Customer, amount, and number of documents |
| Recently added clients | Name, type, acquisition source, email, and registration date. Show more opens Customers |
| Birthdays | Birthdays this month: name, age, email, and date, plus a count |
| RFM matrix | The same recency, frequency, and monetary grid as RFM Analysis |
Project boards can also add widgets that load for one project: funnel stages, tickets by type, inbound channels, channel reply rate, onboarding funnel, open cards, and upcoming touches. Each one shows that project’s name and then the live figures. Retention triggers, SLA cards, reply-rate samples, and the first-reply sparkline are sample layouts. They stay out of the picker while they are marked as sample data, so you will not see invented merchants or invented minutes on a working board.
More than one dashboard
When the company has more than one dashboard, Dashboard in the Home menu becomes a list:
- Main dashboard stays at
/ - Each extra dashboard opens at
/dashboard/{id} - New dashboard appears at the bottom when your role may create dashboards
You only see dashboards you are allowed to view. Opening one you cannot view returns you to the main dashboard.
The gear on the filter bar offers:
| Action | Who can use it |
|---|---|
| New dashboard | People who may create dashboards |
| Manage widgets | People who may edit this dashboard |
| Delete | People who may delete this dashboard. The main dashboard is the one you should keep |
RFM customers on the dashboard
If an RFM widget is on the board, choosing a segment opens a customer list with recency (R), frequency (F), monetary value (M), the combined score, and revenue. That list is a view of the same scoring described in RFM Analysis.
Permissions
Dashboard is its own module. View, create, edit, and delete can be set to no access, own records, all records, or department records. You need edit access on a dashboard before Manage widgets appears.
Related pages
Cash figures come from wallets. Sales and purchase counts come from confirmed documents. Widget data is not edited on the dashboard.