RFM Analysis
Reports → RFM Analysis (/reports/rfm_analysis) scores customers on three questions: how recently they bought (R), how often they bought (F), and how much they spent (M). Each score is placed in a segment so you can see who is active, who is slipping, and who spends the most.
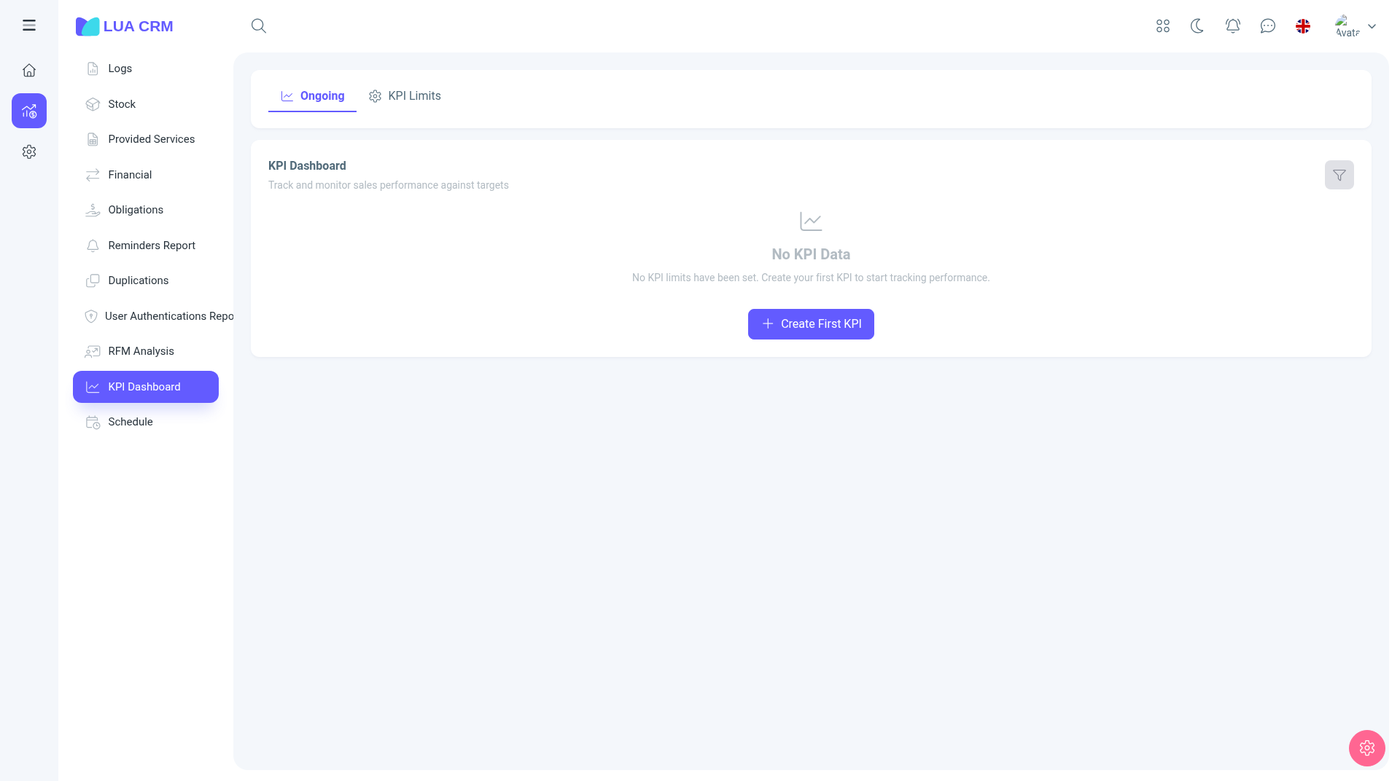
The page uses confirmed sales in the date range. Drafts are not included. Amounts use the company currency.
What is on the page
- KPI cards: total customers in the range, total revenue, average order value, and average purchase frequency
- A 3×3 matrix of recency against frequency and monetary value. The help icon on the matrix explains how a cell is read
- A segment distribution chart and a revenue-by-segment chart
- Top customers by RFM score, with View all opening the full list (customer, R, F, M, score, revenue)
- A segment table: segment name, number of customers, percent of the total, revenue, and average order value
- Segment moves: customers who changed segment, the segment they left, the segment they joined, and the date
Click a segment or a matrix cell to see the customers in it.
Filters
| Filter | Default | Meaning |
|---|---|---|
| Date range | 1 January of this year through today | Which sales count |
| Branch | All branches you can access | Limit the sales to one branch |
Choose Filter after you change either one. The label next to the filter button shows the range currently applied.
Permissions
Has access only. There is no separate print switch on this report. The same segments can appear as a widget on the dashboard.
Tips
- A new customer with one sale lands in a recent, low-frequency segment. That is expected.
- Revenue looks low: the range or the branch is narrower than the sales you remember, or those sales are not confirmed.
- Segment moves are empty when nobody has crossed a boundary since scores were last calculated. Widen the date range.